|
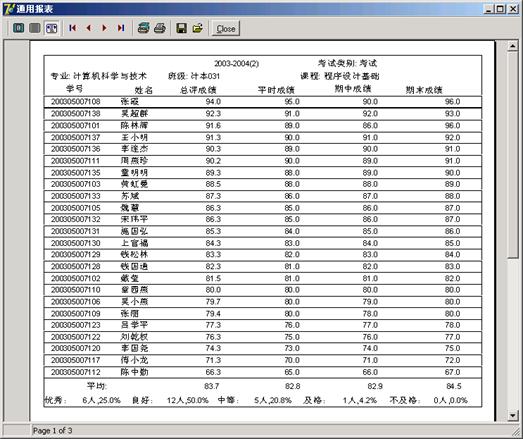
⑷ 每组结束后需要输出该组的汇总信息,所以通过设置组脚带QRBand1的BeforePrint ()事件,计算并显示该组成绩的平均值、各档成绩的人数及比例等信息,相关代码如下:
procedure TFormStatisticsReport.QRBand1BeforePrint(Sender: TQRCustomBand;
var PrintBand: Boolean);
begin
QRLabelAchievement.Caption:=Format('%.1f', [GroupAverage[0]/NumCount]);
QRLabelAchievement1.Caption:=Format('%.1f', [GroupAverage[1]/NumCount]);
QRLabelAchievement2.Caption:=Format('%.1f', [GroupAverage[2]/NumCount]);
QRLabelAchievement3.Caption:=Format('%.1f', [GroupAverage[3]/NumCount]);
QRLabelScope1.Caption := IntToStr(Scope[4]+Scope[5])+'人,'+
Format('%.1f',[(Scope[4]+Scope[5])*100.0/NumCount])+'%';
QRLabelScope2.Caption := IntToStr(Scope[3])+'人,'+
Format('%.1f',[(Scope[3])*100.0/NumCount])+'%';
QRLabelScope3.Caption := IntToStr(Scope[2])+'人,'+
Format('%.1f',[(Scope[2])*100.0/NumCount])+'%';
QRLabelScope4.Caption := IntToStr(Scope[1])+'人,'+
Format('%.1f',[(Scope[1])*100.0/NumCount])+'%';
QRLabelScope5.Caption := IntToStr(Scope[0])+'人,'+
Format('%.1f',[(Scope[0])*100.0/NumCount])+'%';
end;
界面和代码设计完成后,在图2所示的“成绩查询与统计”运行界面中单击“统计报表”按钮运行统计报表界面,运行效果如图4所示。通过“统计分析表”菜单进入时,则图4中没有细节带数据。

图4 统计报表运行界面
|