5.显示报表
报表显示在窗体中,需要做以下三件工作:
(1)重写pictureBox1_Paint事件处理程
pictureBox1的Paint事件在重绘pictureBox控件时发生。在处理程序中简单地调用Table方法,就可以在调整窗体大小或者其他窗体遮蔽了窗体时重绘报表。
pictureBox1_Paint事件处理程序代码如下:
void pictureBox1_Paint( Object^ /*sender*/,
System::Windows::Forms::PaintEventArgs^ e
) // PaintEventArgs为 Paint 事件提供数据。
{
Table(e->Graphics) ;
}
(2)编写ReportForm_Load事件处理程
在窗体ReportForm的Load事件中,将PictureBox控件的Paint事件连接到事件处理器方法,同时将PictureBox控件附加到ReportForm窗体。
ReportForm_Load事件处理程序代码如下:
private: System::Void ReportForm_Load(System::Object^ sender, System::EventArgs^ e)
{
// 将PictureBox控件的Paint事件连接到事件处理器方法。
pictureBox1->Paint += gcnew System::Windows::Forms::PaintEventHandler( this, &ReportForm::pictureBox1_Paint );
// 将PictureBox控件附加到窗体。
this->Controls->Add( pictureBox1 );
}
(3)用主窗体“技术分析”菜单的“制表”命令显示ReportForm窗体
在窗体设计器中打开StockMrktAnls.h文件,单击“技术分析”菜单、然后双击“制表”命令,即在代码编辑器中打开StockMrktAnls.h代码文件,并自动生成了制表ToolStripMenuItem_Click事件的过程体。
在制表ToolStripMenuItem_Click过程中添加以下代码:
private: System::Void 制表ToolStripMenuItem_Click(System::Object^ sender, System::EventArgs^ e)
{
ReportForm^ reportfrm=gcnew ReportForm();
reportfrm ->Show();
}
最后,在StockMrktAnls.h代码文件的顶部添加一行代码,将ReportForm窗体的头文件包含进来:
#include "ReportForm.h"
三、打印
在 Windows 窗体中,进行打印的基础是 PrintDocument 组件。
当需要为当前页打印输出时,调用PrintDocument 组件的Print 方法,并引发PrintPage 事件。可以在PrintPage 事件中指定打印内容和打印方式。
⒈ 添加 PrintDocument 组件
将 PrintDocument 组件添加到窗体,它会出现在 Windows 窗体设计器底部的栏中。如图4所示。
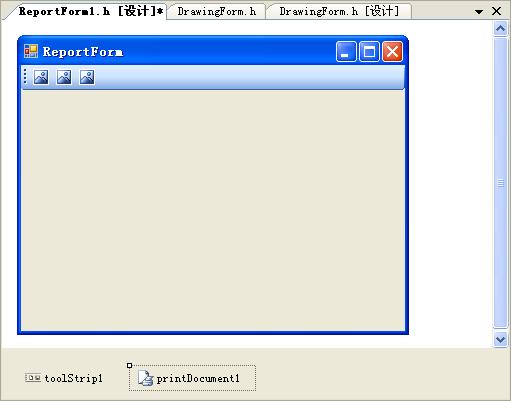
图4 PrintDocument 组件被添加到窗体
⒉ 编写PrintPage 事件处理程序
在PrintPage 事件处理程序中,需要指定打印的报表和打印方式。
显示的报表是通过Table方法实现的。打印的报表与显示的报表在内容上是相同的,但是打印的报表需要对报表进行分页。因此,PrintPage 事件处理程序与Table方法会有一些差别。
由于PrintPage 事件只处理一页报表的打印,需要为报表中数据的记录创建一个类(窗体)级的指针,并初始化为0:
private: static int rcrdNum=0; // 数据表记录指针。
每打印完一页报表,都要判断数据表记录是否已打印完,如果已打印完,设置e->HasMorePages为“false”,表示不再打印;否则,设置e->HasMorePages为“true”,表示继续打印下一页。
双击PrintDocument 组件图标,编写printDocument1_PrintPage代码:
private: System::Void printDocument1_PrintPage(System::Object^ sender, System::Drawing::Printing::PrintPageEventArgs^ e)
{
// 构造SQL select语句。
String^ selectCommand="select convert(varchar(10),日期,120) as '日期',开盘价,收盘价,成交量,最高价,最低价 from StockList";
// 调用GetData方法返回包含个股(指数)数据的数据表。
DrawingForm^ drawingfrm=gcnew DrawingForm();
DataTable^ table = drawingfrm->GetData(selectCommand);
int dayCount=table->Rows->Count; // 数据表记录(交易日)数。
if (dayCount<=0)
{
MessageBox::Show( "无数据!");
return;
}
// 获取表示边距以内的页面部分的矩形区域--Rectangle结构。
float p_left = e->MarginBounds.
Left; // 边距以内页面部分的矩形区域左边缘的 x 坐标。
float p_top = e->MarginBounds.
Top; // 边距以内页面部分的矩形区域上边缘的 y 坐标。
float p_width=e->MarginBounds.
Width; // 边距以内页面部分的矩形区域的宽度。
float p_h=p_top; // 累计报表页面(含边距)高度。
float rs=5.0F; // 行间距。
float cs=3.0F; // 列间距。
const int cn=6; // 报表细节的列数。
// 创建Graphics对象。
Graphics^ g =e->Graphics;
// 绘制页眉。
String^ ttlString = "上证指数行情表";
int fn=14; // 设置字号。
float fp_q=1.0F; // 字号放大比例。
System::Drawing::Font^ ttlFont =
gcnew System::Drawing::Font("Arial", fn*fp_q,
GraphicsUnit::Pixel); // 设置字体。
System::Drawing::SolidBrush^ ttlBrush = gcnew
System::Drawing::SolidBrush(System::Drawing::
Color::Black); // 准备实心画笔。
SizeF ttlSize = g->MeasureString(
ttlString, ttlFont);
float ttlWidth= ttlSize.Width; // 获取页眉宽度(像素个数)。
float ttl_x =p_left+(p_width-
ttlWidth)/2; // 为使页眉在页面水平方向居中,计算页眉的起始横坐标。
float ttl_y=p_top; // 页眉的起始纵坐标。
g->DrawString( ttlString,ttlFont,
ttlBrush ,ttl_x,ttl_y); // 画页眉。
p_h=p_h+ttlSize.Height;
// 画报表细节。
float scale_Date=10.0F; // “日期”列宽度因子。
float scale_Quantity=10.0F; // “成交量”列宽度因子。
float scale_Price=8.0F; // 每一“价格”列宽度因子。
float pels=(p_width-cs*cn*2)/(scale_Date+
scale_Quantity+scale_Price*(cn-2)); // 象数个数/每因子。
float width_Date=pels*scale_Date; // “日期”列宽度。
float width_Quantity=pels*scale_Quantity; // “成交量”列宽度。
float width_Price=pels*scale_Price; // 每一“价格”列宽度。
float x[cn]; // 各列起始 x 坐标。
x[0]=p_left+cs; // 第一列起始 x 坐标。
x[1]=x[0]+cs*2+width_Date; // 第二列起始 x 坐标。
x[2]=x[1]+cs*2+width_Price; // 第三列起始 x 坐标。
x[3]=x[2]+cs*2+width_Price; // 第四列起始 x 坐标。
x[4]=x[3]+cs*2+width_Quantity; // 第五列起始 x 坐标。
x[5]=x[4]+cs*2+width_Price; // 第六列起始 x 坐标。
float rect_w[cn]; // 各列布局矩形框的宽。
rect_w[0]=width_Date; // 第一列布局矩形框的宽。
rect_w[1]=rect_w[2]=rect_w[4]=rect_w[5]=
width_Price; // 第二、三、五、六列布局矩形框的宽。
rect_w[3]=width_Quantity; // 第四列布局矩形框的宽。
float rect_h=100.0F; // 每列布局矩形框的高。
System::Drawing::Pen^ penTab =
gcnew System::Drawing::Pen(System::Drawing::Color::Black); // 准备画笔。
// 画报表细节――表头。
p_h=p_h+rs;
float vy1=p_h; // 竖线起始点y 坐标。
g->DrawLine(penTab,x[0], p_h,
x[0]+p_width, p_h); // 画横线。
p_h=p_h+rs;
System::Drawing::StringFormat^ tabFormat =
gcnew System::Drawing::StringFormat(StringFormatFlags::NoClip);
fp_q=0.8F; // 字号放大比例。
Rectangle rect = Rectangle(Point(x[0],p_h),System::Drawing::Size( rect_w[0],rect_h ));
g->DrawString("日期", ttlFont, ttlBrush, rect, tabFormat); // 画第一列标头。
rect = Rectangle(Point(x[1],p_h),System::Drawing::Size( rect_w[1],rect_h ));
g->DrawString("开盘价", ttlFont, ttlBrush, rect, tabFormat); // 画第二列标头。
rect = Rectangle(Point(x[2],p_h),System::Drawing::Size( rect_w[2],rect_h ));
g->DrawString("收盘价", ttlFont, ttlBrush, rect, tabFormat); // 画第三列标头。
rect = Rectangle(Point(x[3],p_h),System::Drawing::Size( rect_w[3],rect_h ));
g->DrawString("成交量", ttlFont, ttlBrush, rect, tabFormat); // 画第四列标头。
rect = Rectangle(Point(x[4],p_h),System::Drawing::Size( rect_w[4],rect_h ));
g->DrawString("最高价", ttlFont, ttlBrush, rect, tabFormat); // 画第五列标头。
rect = Rectangle(Point(x[5],p_h),System::Drawing::Size( rect_w[5],rect_h ));
g->DrawString("最低价", ttlFont, ttlBrush, rect, tabFormat); // 画第六列标头。
float r_h=g->MeasureString("测试", ttlFont,System::Drawing::Size( rect_w[5],rect_h ),tabFormat).Height;
p_h=p_h+ r_h;
g->DrawLine(penTab,x[0], p_h,
x[0]+p_width, p_h); // 画横线。
// 画报表细节――数据。
while (p_h <= e->MarginBounds.Bottom && rcrdNum<
dayCount) // Bottom是边距以内页面部分的矩形区域的 // 左上角的 y 坐标与高度(Height)之和。
|